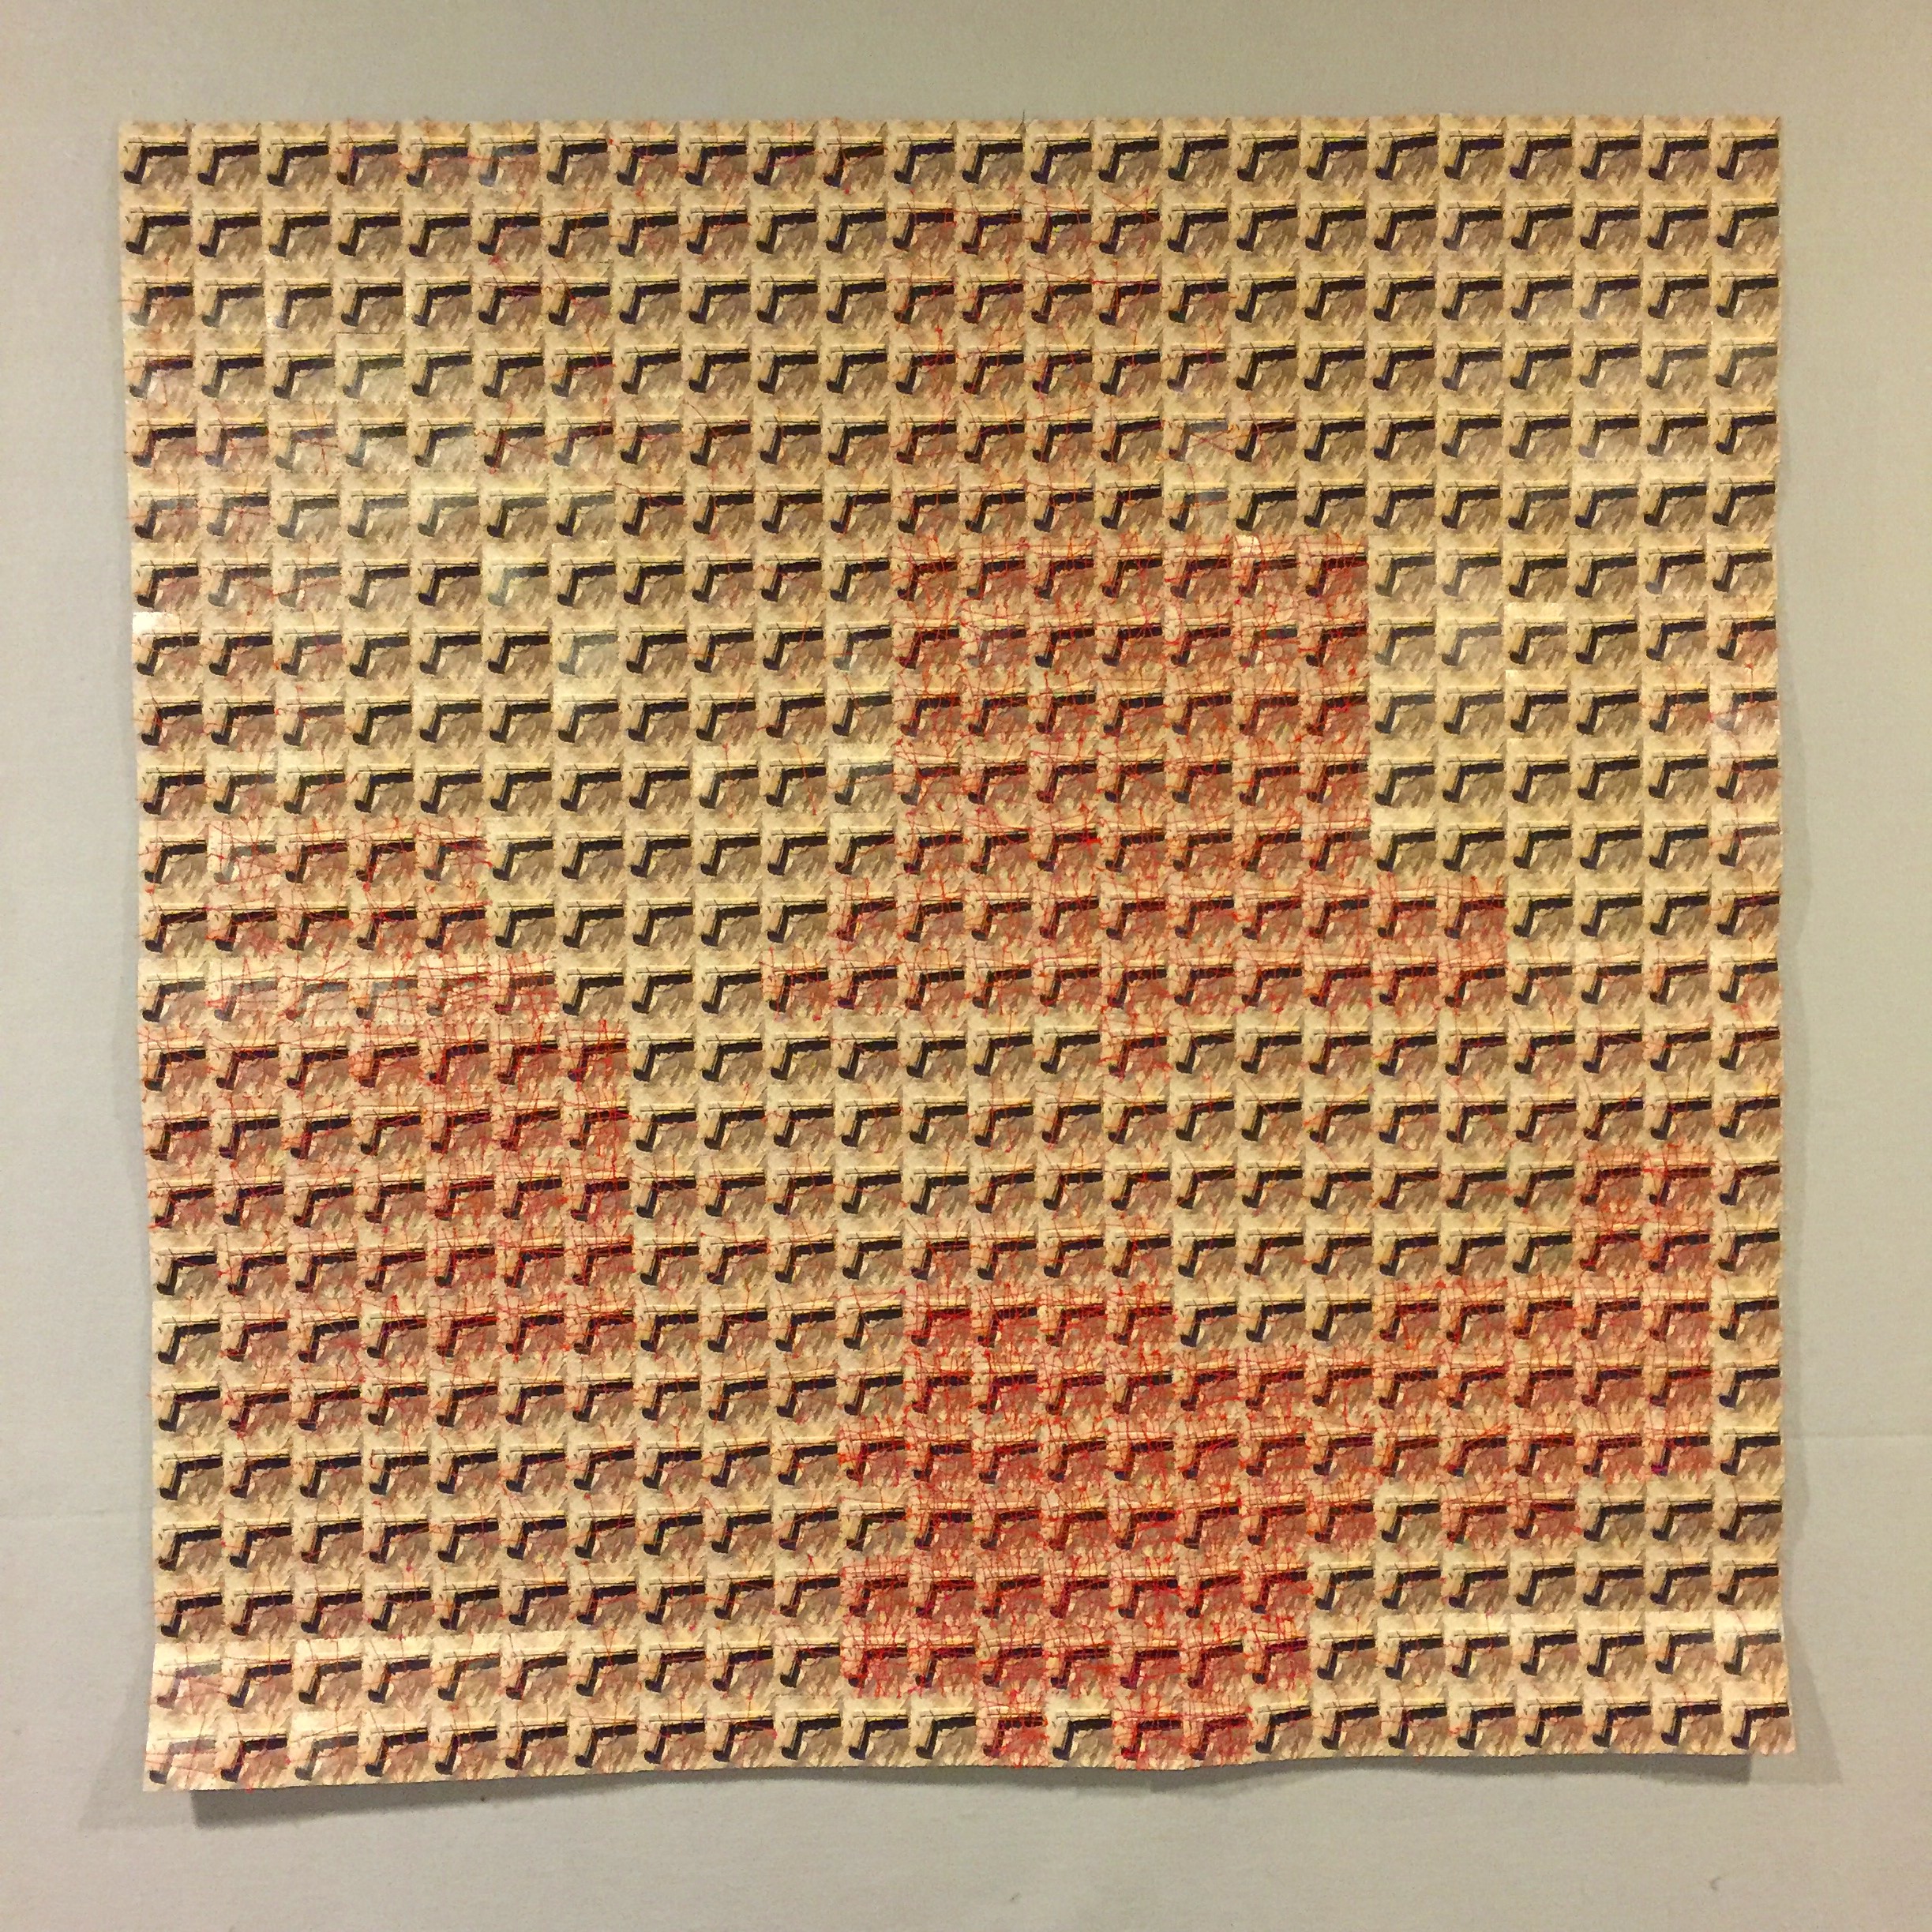
34″ x 34″
2018
$300
This photoquilt is the second in a series of maps of Columbus, Ohio. The first included the median home values for every zip code in Columbus. This one records the number of homicides in each zip code.
Sadly, Columbus set a new record for the number of homicides in 2017 with 143. In this photoquilt, every square in a given zip code receives a line of red stitching for each homicide in that zip code which ranges from 0 to 17.
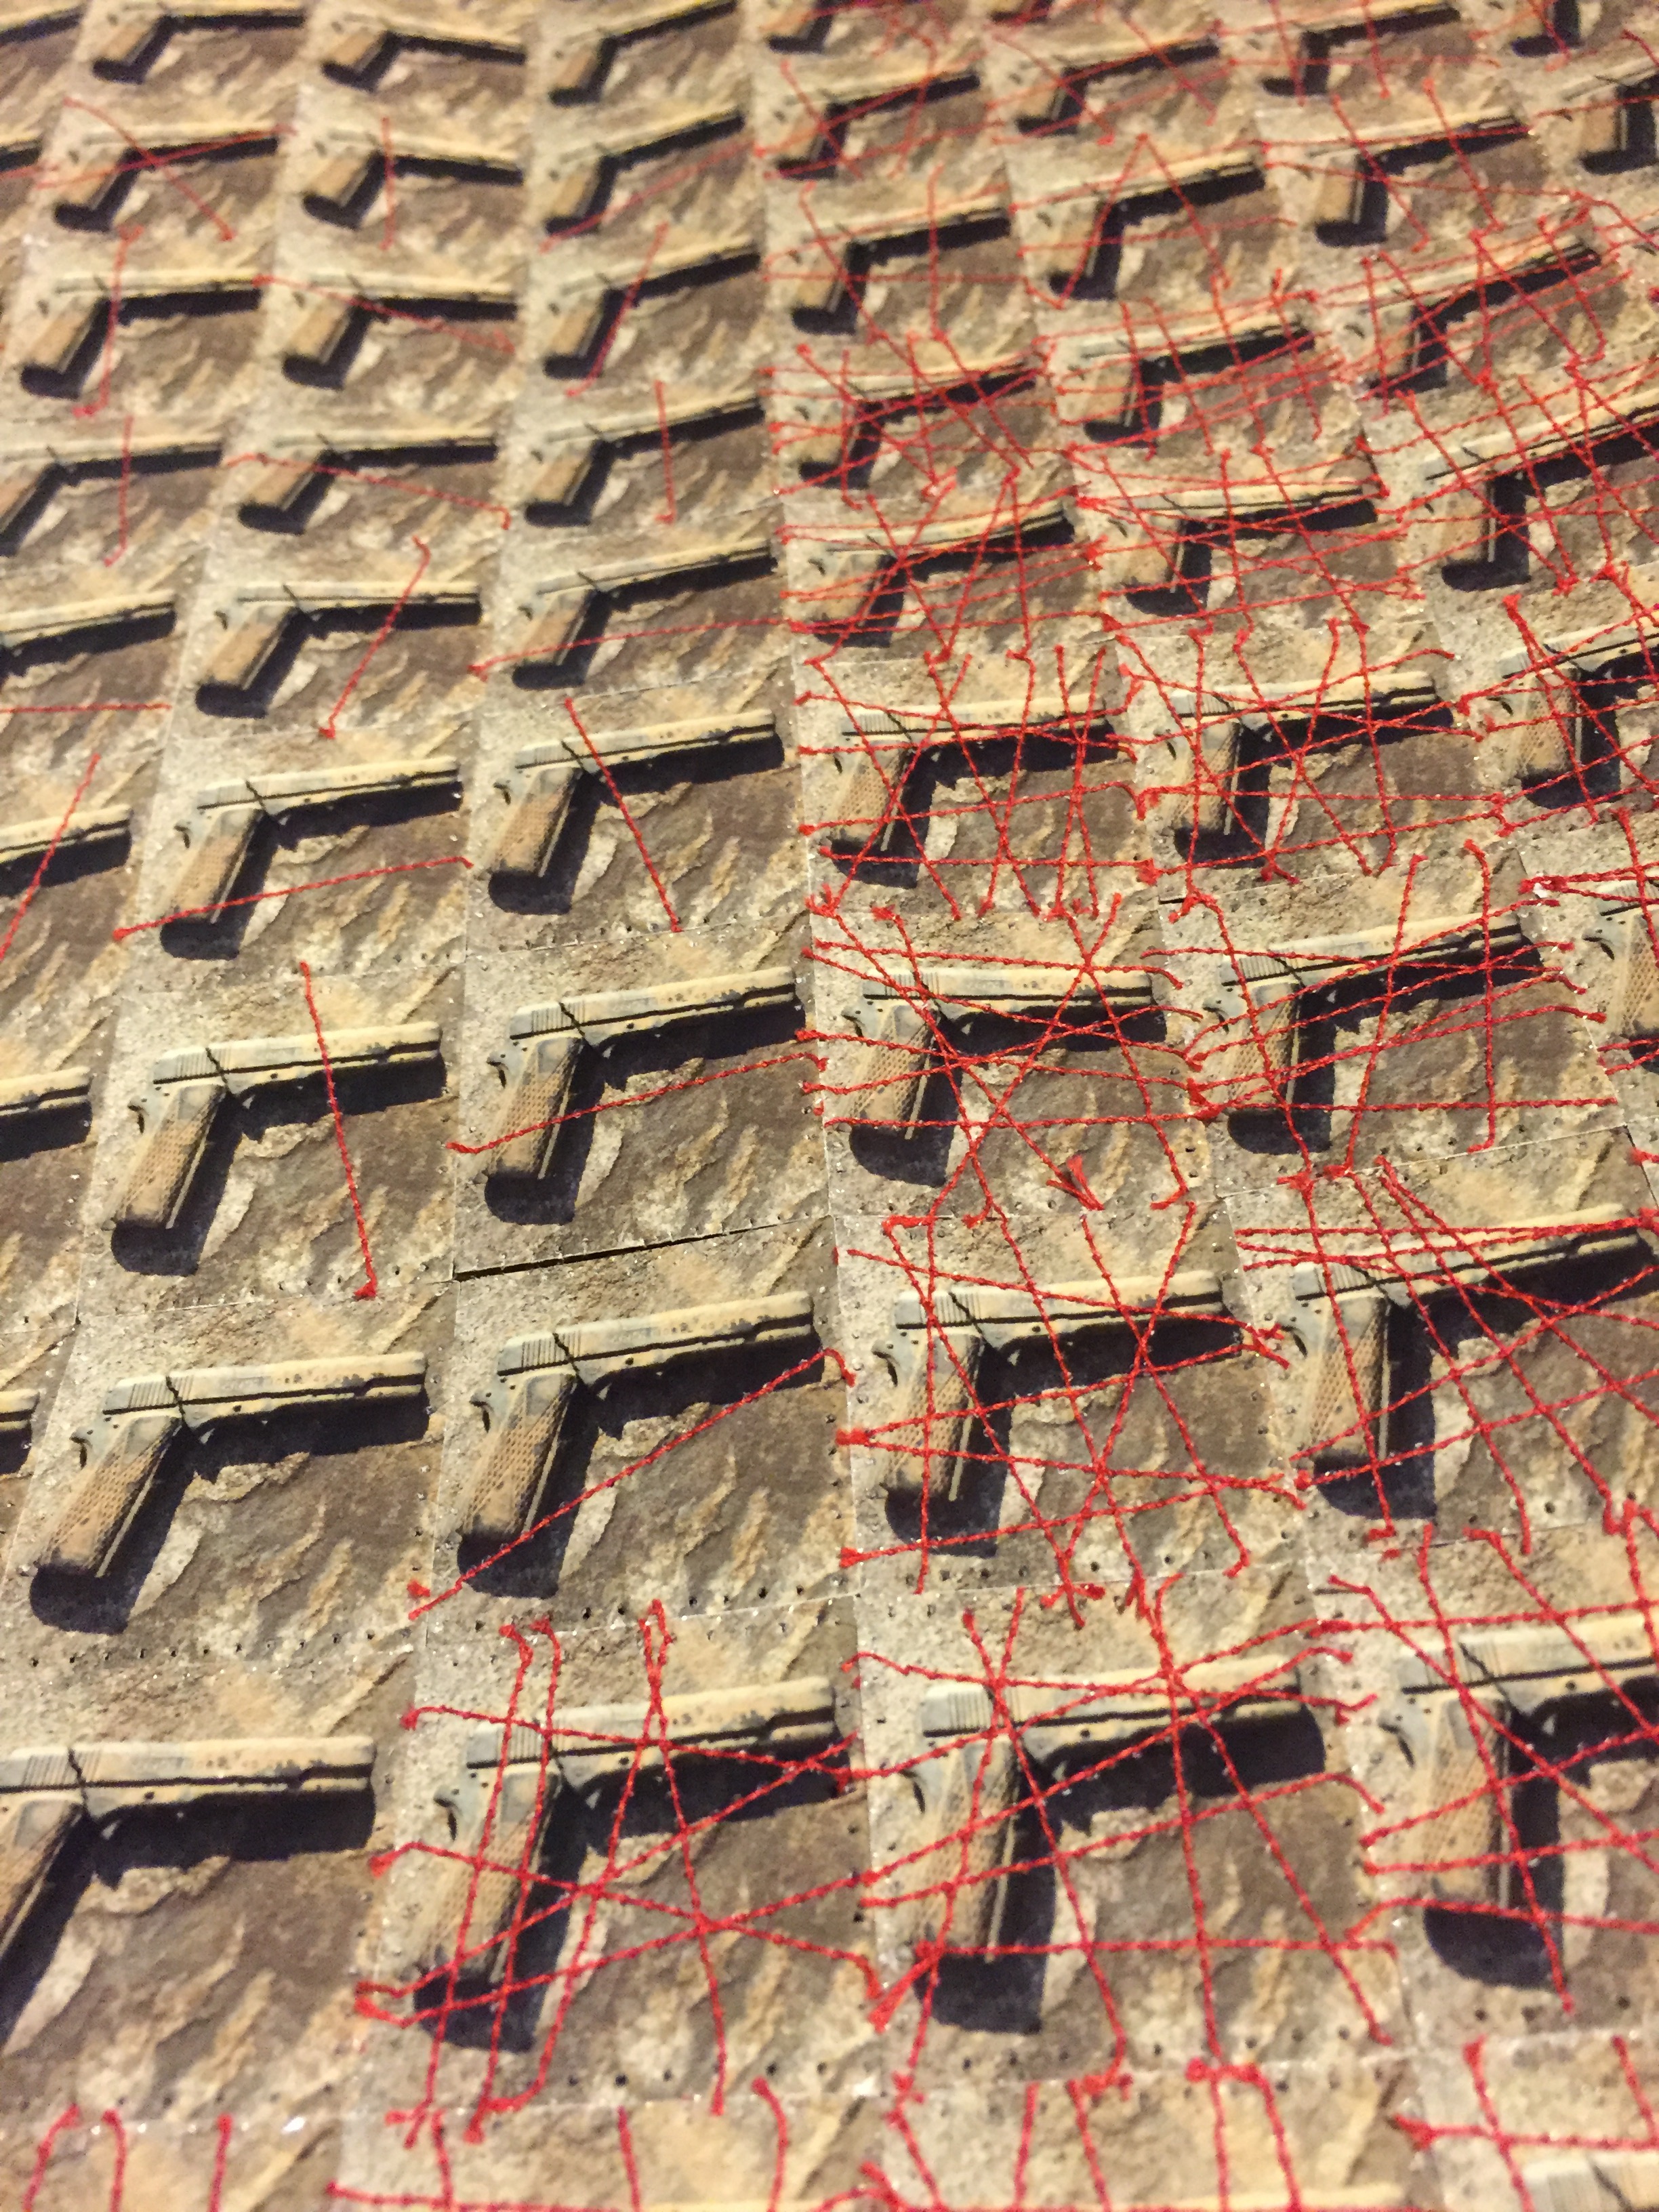
detail
The differences between neighboring zip codes are striking and, perhaps not surprisingly, correlate strongly with the median home values within each zip code.
I chose an image of a gun because 83% of the homicides involved a gun. The photo is a picture of an old toy gun that I dug up in my backyard and photographed against my patio. I really struggled with an appropriate image to use, but went with this one because it has a camouflage feel.
Because one image is used for the entire map, the zip codes are not as easy to distinguish. However, clear patterns emerge as some zip codes are much redder than others.