 from top to bottom: mobile, herald, ocala, write, land, territorial, ship, john, cotton, fernandina, expedition, settler and from left to right: 1959 to 1978
This piece is still a work in progress, but it’s been in progress for long enough that it’s time to share it. I’ll continue to update this post until it is completed.
It all started with a conversation I had with David Staley, a futurist history prof who teaches design and thinks about things like digital humanities. He had worked with colleague Matt Lewis on a dataset they gleaned from the Florida Historical Quarterly, an academic journal. The set contained the one hundred most frequent keywords across the 86-year history of the journal. On paper, the dataset looks like a table with the years 1924 through 2009 across the top, keywords like john, tallahassee, and cotton down the side, and numbers creeping into the low teens scattered throughout. It’s a very rich dataset, but it ain’t much to look at. So, they 3D printed it.
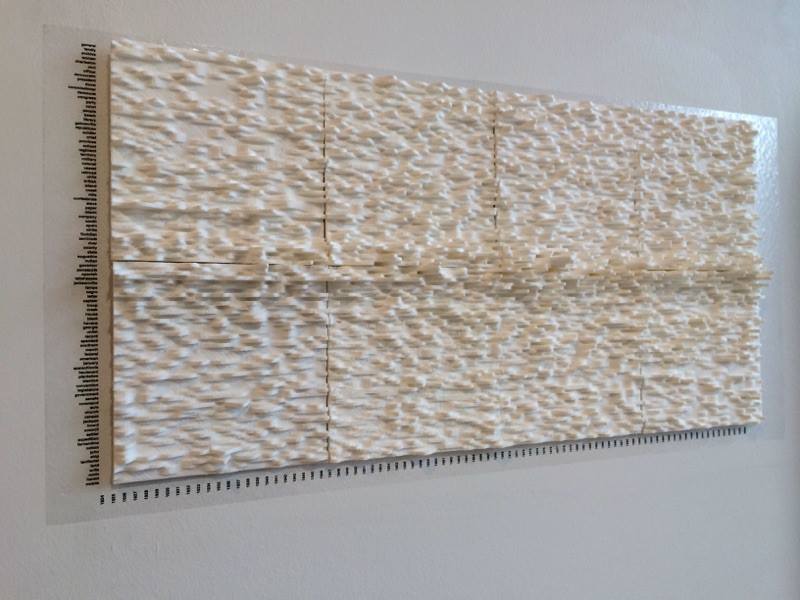 3D printed data
Once it was printed out, new patterns started to emerge — for example, the decline of the term negro and the increase of the term black to refer to African Americans. Sure, these patterns were there when the data was encoded in numbers, but the virtual absence of the keyword black — it occurs just three times from 1924-1967 — was more obvious as a physical trough within the dataset.
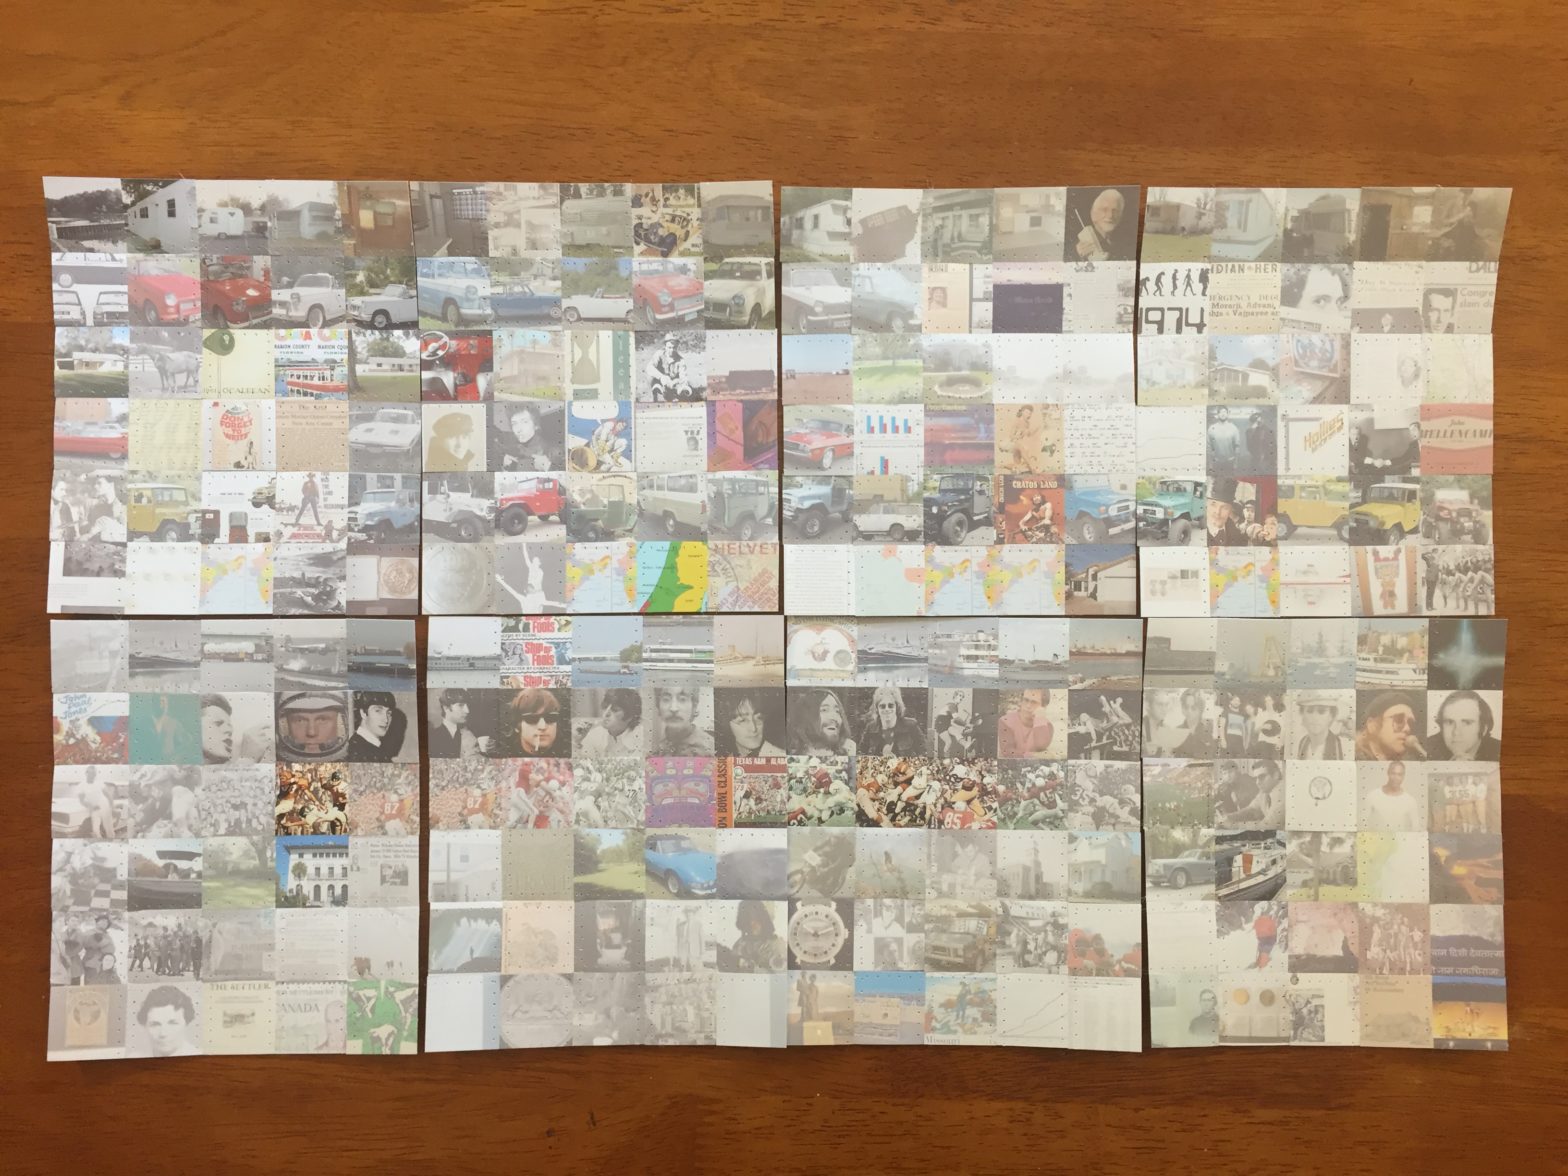
I started to think how I would interpret the same data through a photoquilt. I decided to look at the highest ranked photo on a Google image search of every combination of keywords and years. For example: cotton 1924, cotton 1925, … cotton 2008, cotton 2009, etc. To form the quilt, I digitally cropped every image, printed them out onto standard 4″ x 6″ prints, physically cropped them into one-inch squares, and started sewing them together.
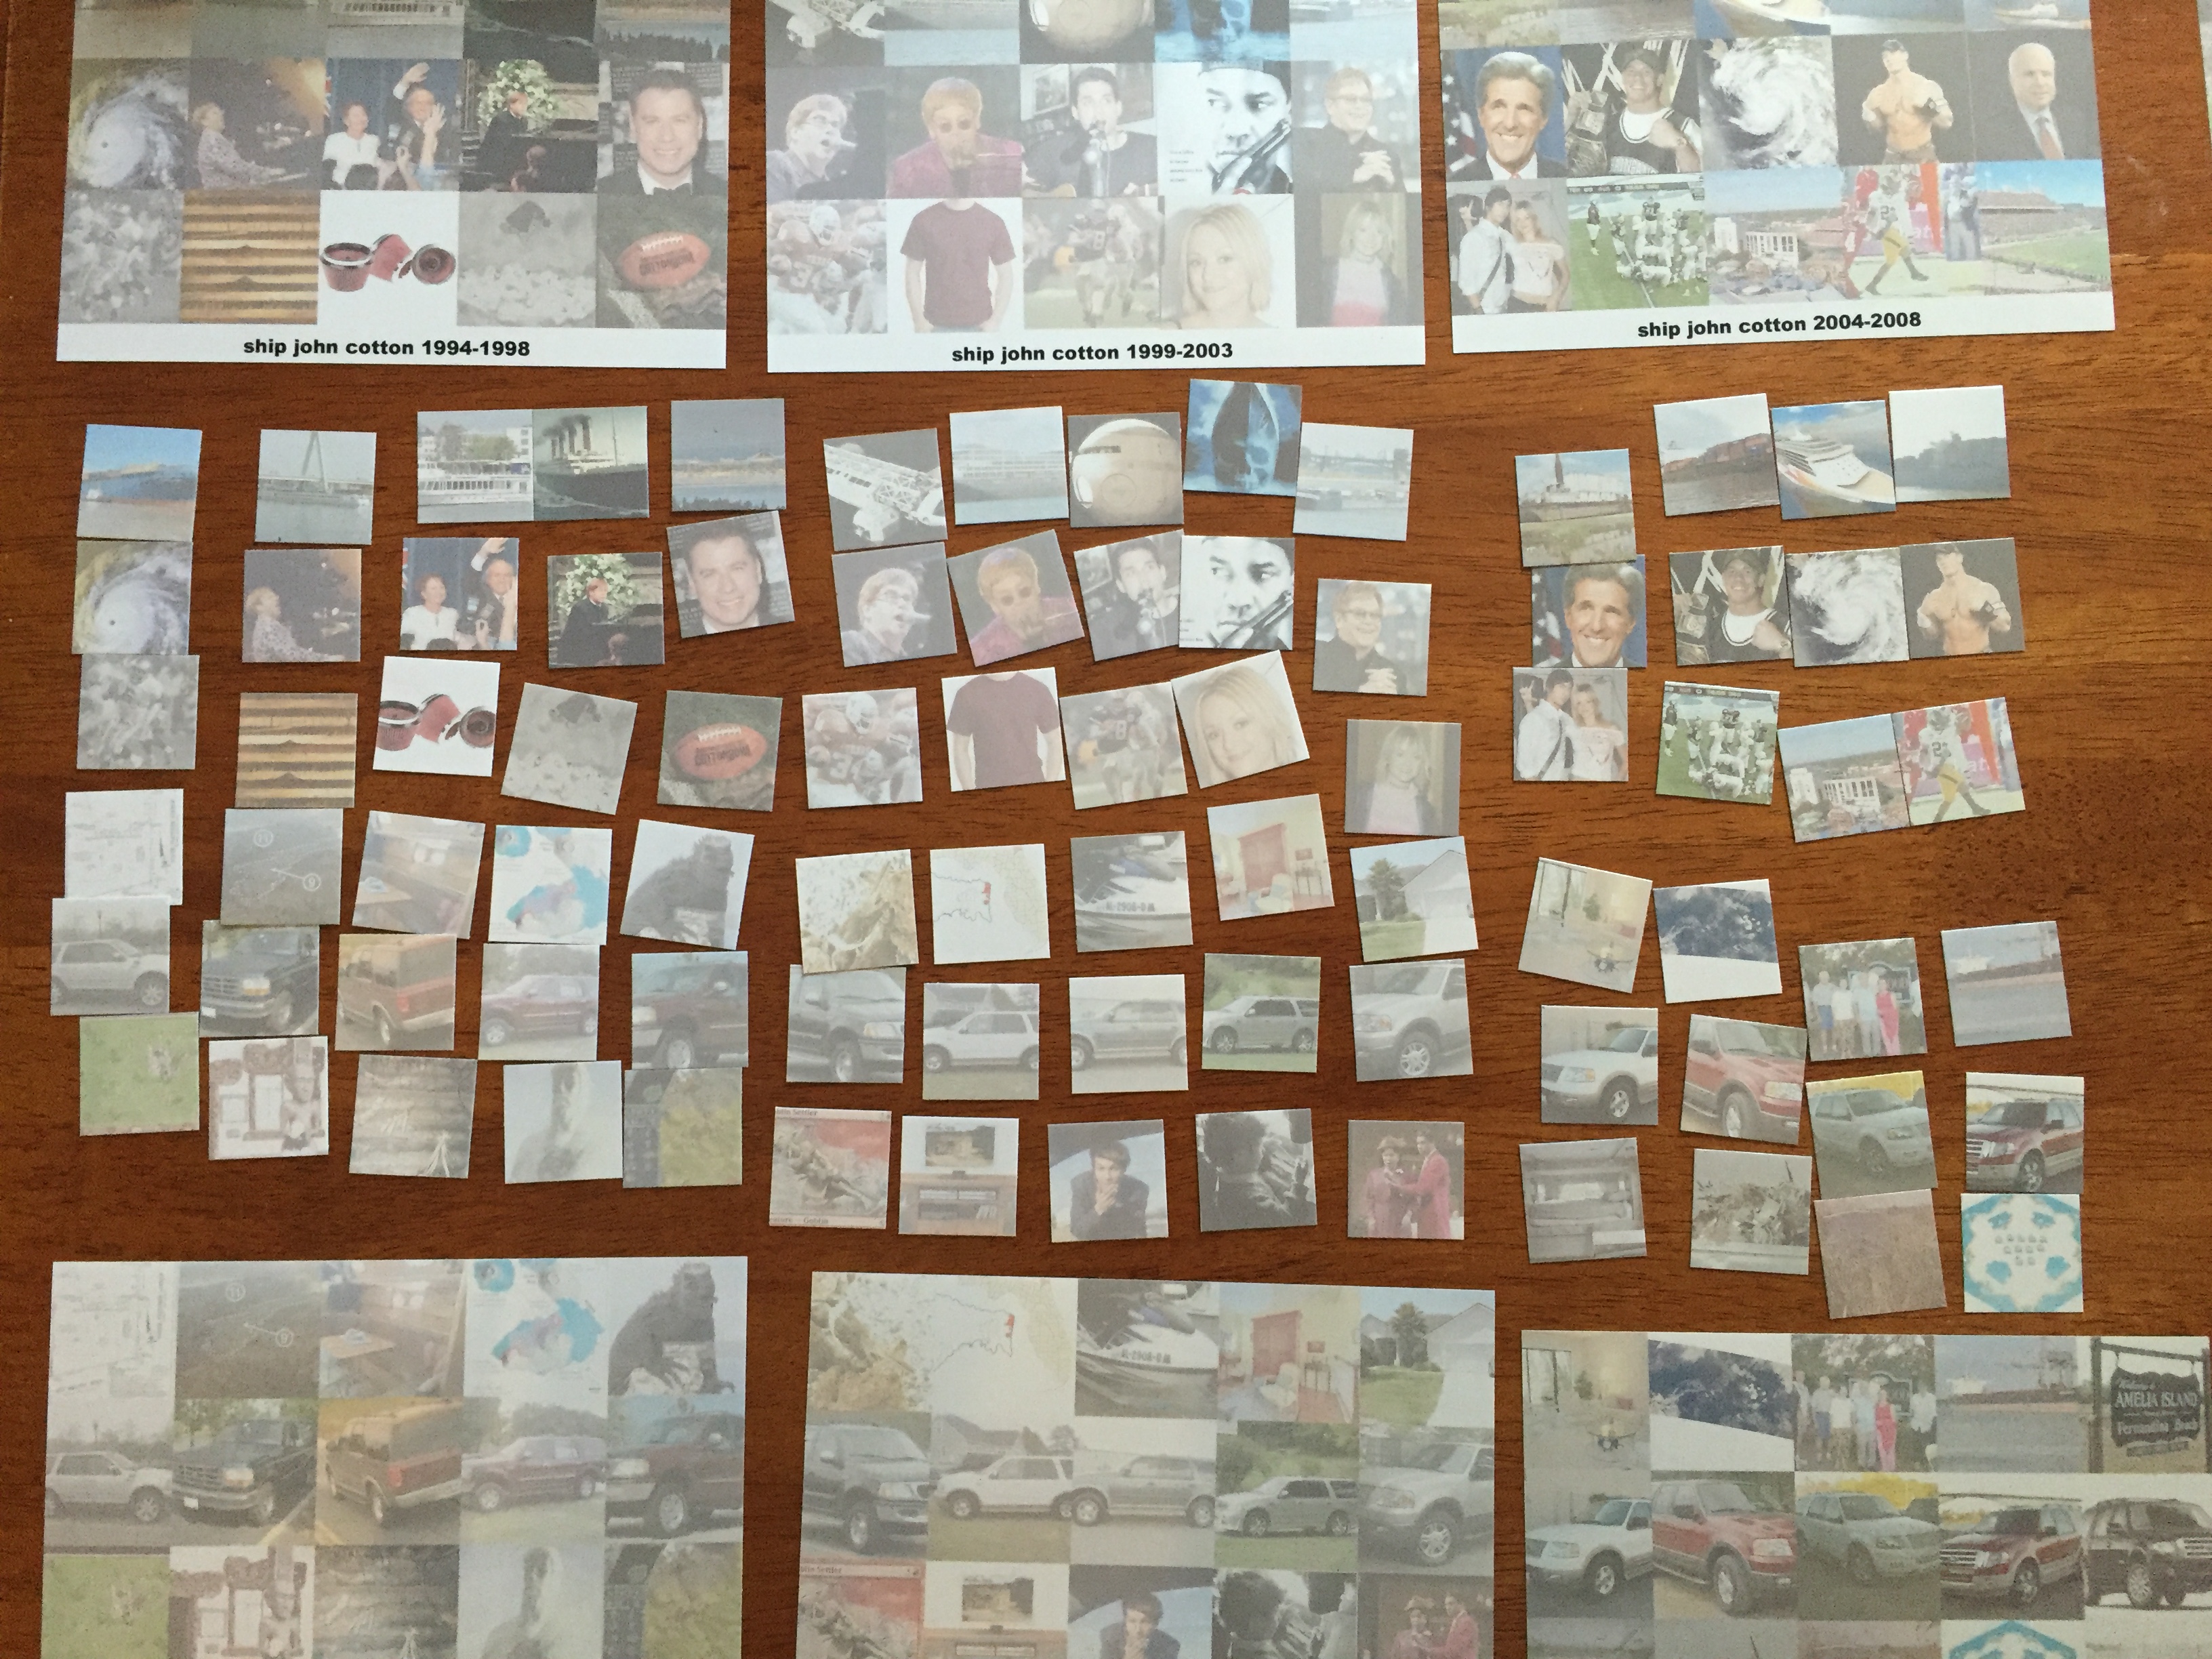 ship to settler, 1994-2009; cropped
Viewing the original data through the lens of the Google search algorithm provided me with an interesting dataset of my own. It is a way to view a visual culture (in the cotton examples above, the meaning shifts from the agricultural product to the annual college football game) but it is also tailored to the time and place that I did the searching. Anyone else doing identical searches would get different results based on all of the factors considered by Google’s search algorithm. In fact, some of the search results have changed since I did my first round of searches. Other photos would not have been included in the search results had I performed the searches earlier in time.
Within the collection of images, several interesting patterns and trends emerged. For example, John Lennon was the highest ranked john in 1940, his birth year, and he dominates most of the 1960s, along with a couple of John F. Kennedys, before being briefly supplanted by Elton John in the 1970s. Lennon returns around the time of his death in 1982, however. This set provides an interesting interpretation of the most popular “John” for each year (according to Google’s algorithm). Other terms reflect similar cultural transitions: mobile evolves from a city in Alabama to the art of Alexander Calder to the telephone, expedition from polar explorers to a popular SUV.
The term negro is another interesting case. The first half of the twentieth century provides a lot of what you might expect — lots of Negro League Baseball team photos with occasional caricatures and stereotypical portrayals of African Americans. But in the later years, the use of negro as the Spanish word for black dominates, mostly in the form of black cars for sale in each model year. (For example, cars are the top 14 search results I get for negro 2006. Your results may vary depending on your computer’s settings.)
I found cars to be among the most common search results along with real estate for sale, movie posters, portraits, and maps. I had assumed that when I searched for one of the many cities that were keywords I would see an image of that city from that year. But often I would get an image of a house for sale at that address in that city. For example, fenandina 1957 returns several images of a house on Amelia Oaks Drive. (Again, your results may vary.) In fact, I had been lulled into a bit of complacency about searching for these towns when I came upon augustine 1964, which depicts a man dumping acid in a pool in response to a civil rights protest by black and white swimmers in a whites-only pool. I didn’t know anything about this incident, which made the image even more shocking to me.
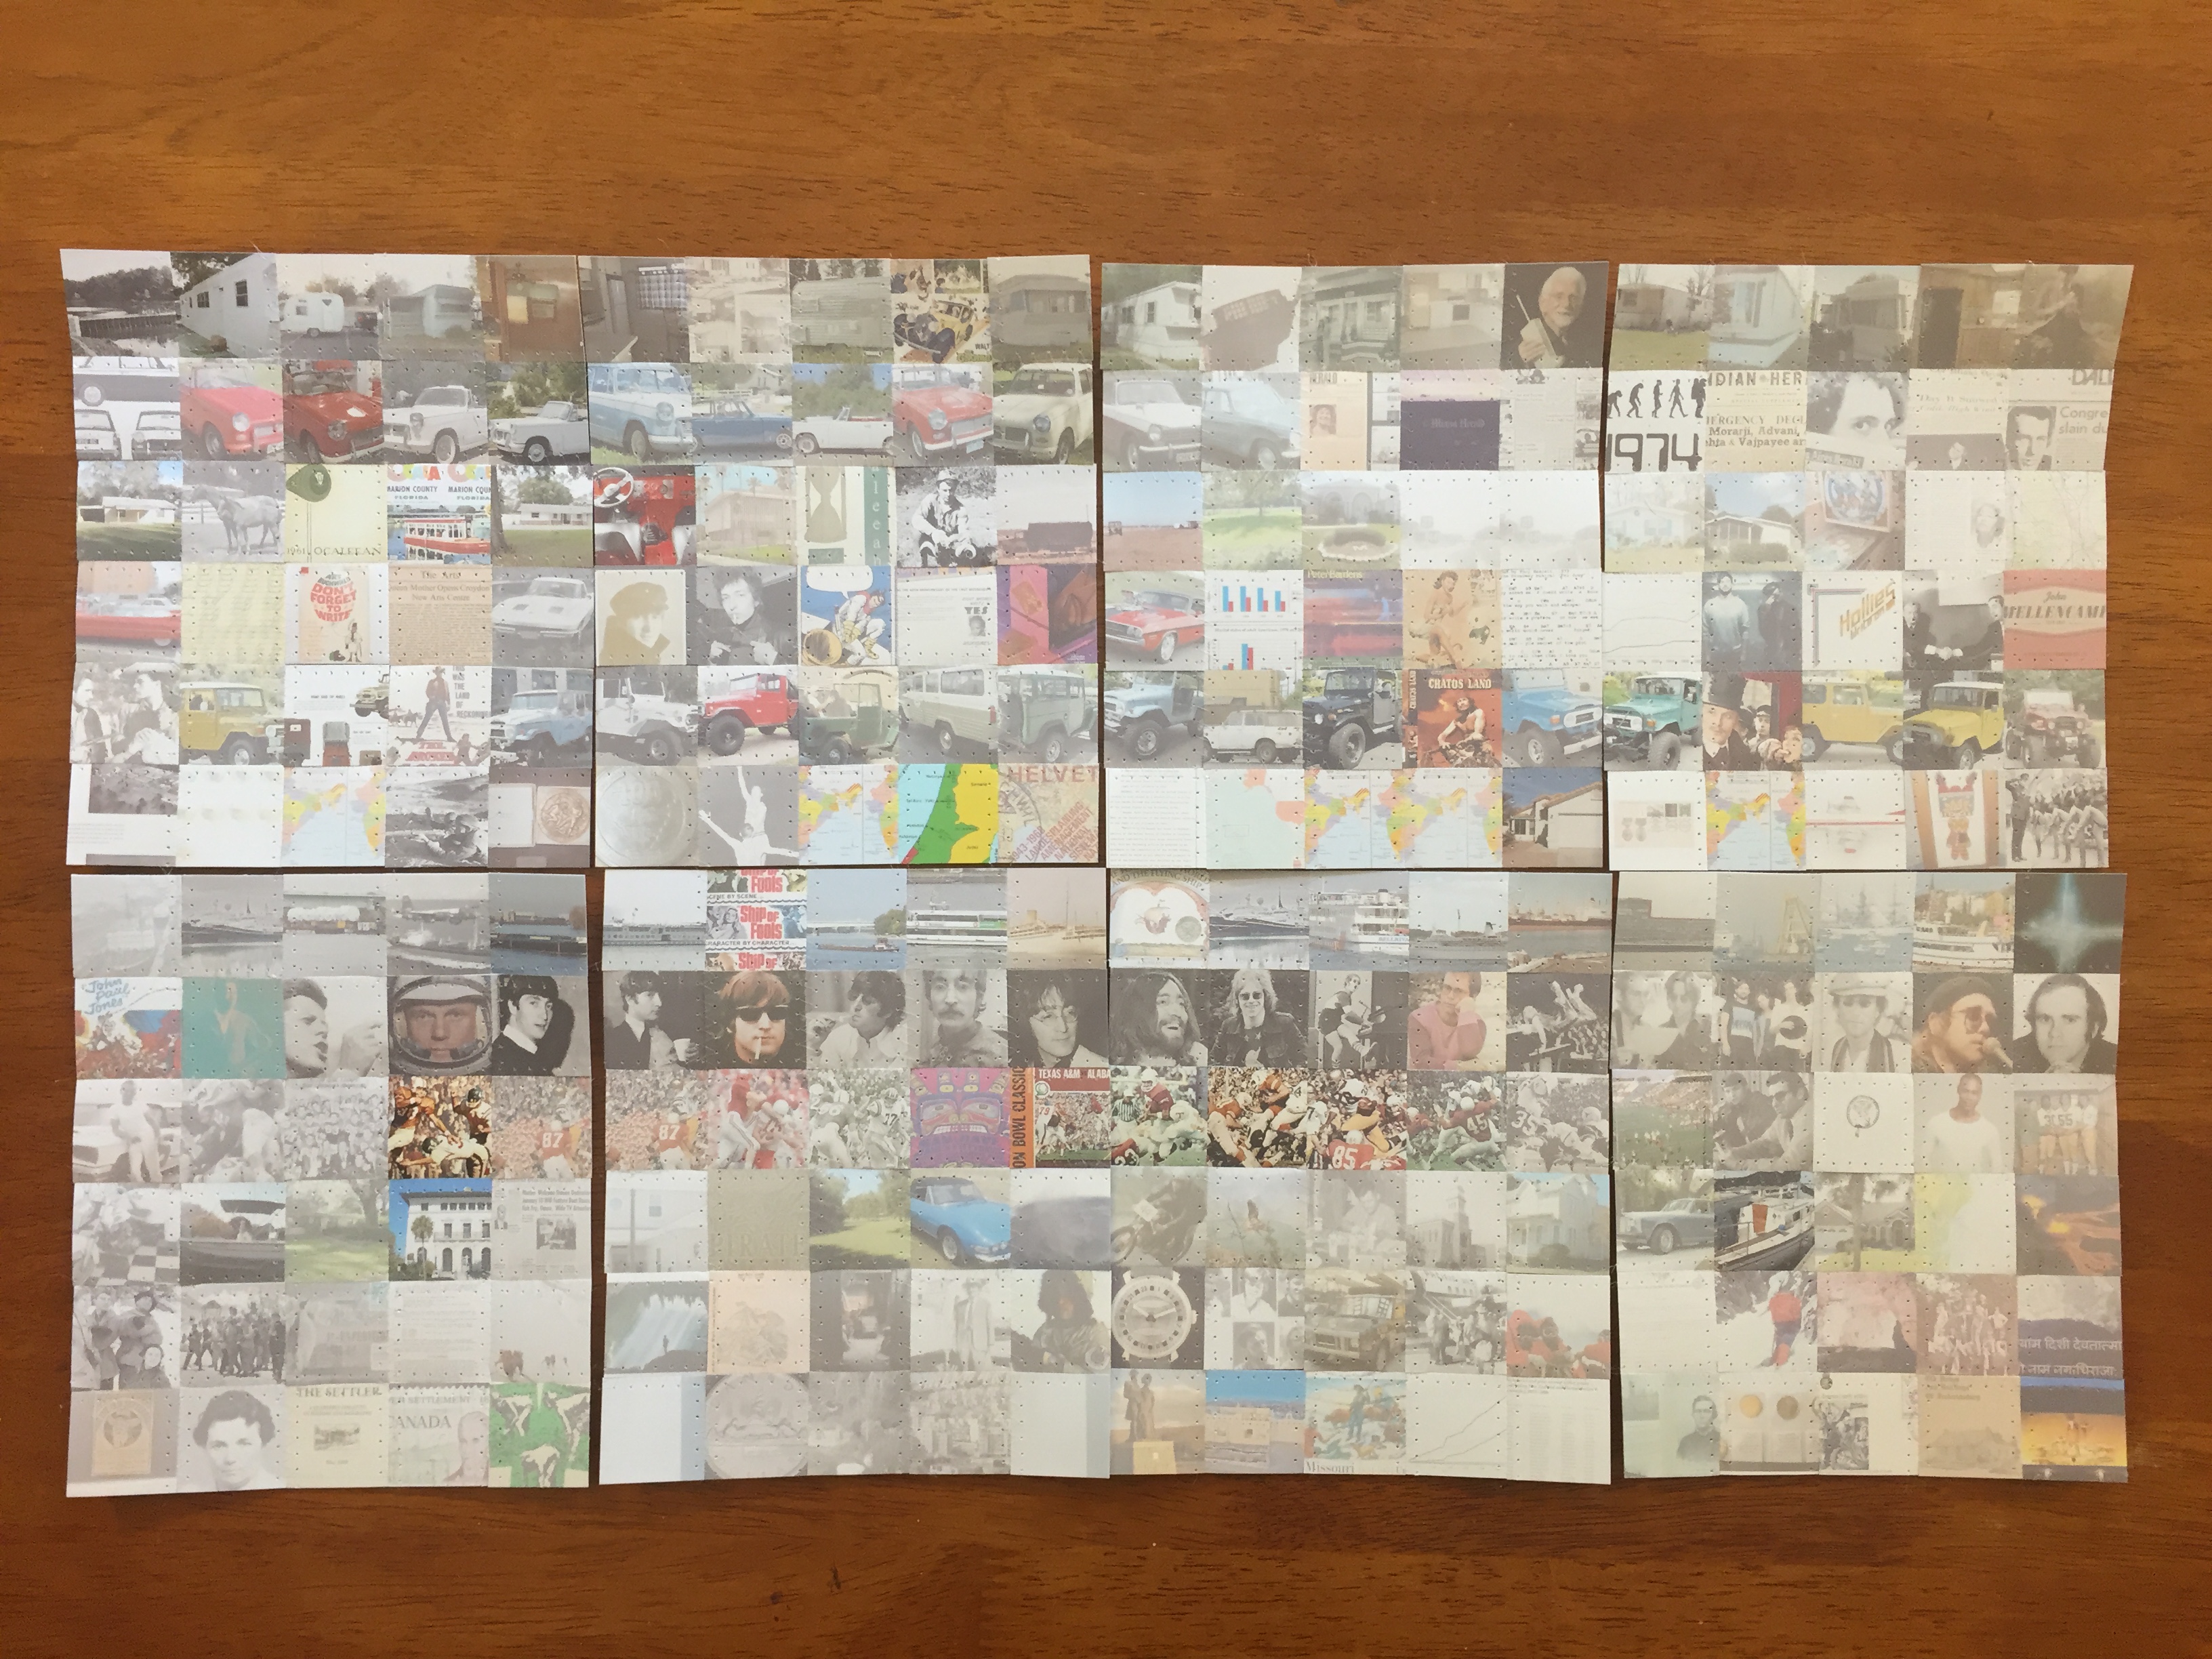
 ship to settler, 1994-2009; sewn into blocks
When finished the quilt will measure 86″ by 100″, which works out to 7’2″ by 8’4″. I have encoded the peaks and valleys of the original dataset by fading out the images that represent the combination with fewer keywords. From a distance, the viewer should be able to make the patterns in the data, but up close the patterns of the individual images will be visible. So far, I’ve completed blocks for 12 out of the 100 rows of 1″ squares. Stay tuned for updates as I make more progress.